Get Started COVID-19
How’s the craic? Get Started COVID-19 You are probably aware about Coronavirus or Covid-19 pandemic. It is a good chance that you are reading this while self quarantined at your home, social distancin
How’s the craic?
Get Started COVID-19
You are probably aware about Coronavirus or Covid-19 pandemic.
It is a good chance that you are reading this while self quarantined at your home, social distancing from public and like many, have very much extra time to deal with.
TL;DR
I came with the idea to create this blog post to maybe help or give some ideas for you to start something. if you are familiar with programming, Developer, Coder, Data something, you should give a go and try or start something.
This post is a collection of links, videos, tutorials and blogs that I found mixed with my opinion.
Table of contents
- Some articles to start
- Datasets
- APIs
- Dashboards
- Ideas
- Code
- Link
1.Some articles to start
You can start with reading “Coronavirus: Why You Must Act Now”, this article has received over 40 million views in the last week. And “Coronavirus the hammer and the dance”
2.Datasets
In the wake of the Coronavirus outbreak, many data sources have been made available to the public in an effort to encourage research in the field. Recently, the White House and a group of leading researchers published the COVID-19 Open Research Dataset (CORD-19), which is available on Kaggle.
Kaggle calls data scientists to action on COVID-19
I found these three links
https://www.kaggle.com/sudalairajkumar/novel-corona-virus-2019-dataset
https://www.kaggle.com/allen-institute-for-ai/CORD-19-research-challenge
https://www.kaggle.com/kimjihoo/coronavirusdataset
This link is the most famous or quoted for data source;
https://github.com/CSSEGISandData/COVID-19
3.APIs
But I found some APIs as well;
https://covid-19-apis.postman.com/
https://thevirustracker.com/api
https://covid19api.com/
https://github.com/NovelCOVID/API
https://github.com/ahmadawais/corona-cli
https://github.com/ExpDev07/coronavirus-tracker-api
4.Dashboards
List of Dashboards;
Maybe the famous one;
https://coronavirus.jhu.edu/map.html
A complete one and interactive;
http://gabgoh.github.io/COVID/index.html
A ready nice one about “Flatten the curve”
https://www.washingtonpost.com/graphics/2020/world/corona-simulator/
https://towardsdatascience.com/covid-19-open-source-dashboard-fa1d2b4cd985
https://towardsdatascience.com/covid-19-dashboard-b7f8b7c59431
https://www.covidvisualizer.com/
5.Ideas
There are several ideas around, and because the ideas are based on data analyses and similar topics Oracle OCI data Science is a good place to give a go.
Start free
Oracle DataScience Docs
video
You can use an open-source OCI Marketplace image as well, (GPU as optional), and talking about GPU, NVidia provides a free 90-day license to Parabricks
I created a list of links with some ideas that I found;
Just a simple start point to read the data and start playing with Python and Pandas
https://towardsdatascience.com/how-to-get-started-analyzing-covid-19-data-808822437c32
https://towardsdatascience.com/exploring-covid-19-research-publications-407f8c2aa842
Text Analysis
https://towardsdatascience.com/using-topological-text-analysis-for-covid-19-open-research-challenge-184d44bb92a6
https://towardsdatascience.com/machine-learning-the-coronavirus-9cb8352e1b36
https://medium.com/@noahhaber/flatten-the-curve-of-armchair-epidemiology-9aa8cf92d652
Apache Spark
https://medium.com/@sunetrobanerjee/understanding-covid-19-coronavirus-with-apache-spark-and-zeppelin-70c285097b68
SNA
https://www.againstcovid19.com/singapore/clusters
https://theconversation.com/how-to-model-a-pandemic-134187
There are some initiatives in the maker community as well;
ventilator hackathon
Ultimate Medical Hackathon: How Fast Can We Design and Deploy an Open Source Ventilator?
Facebook group – Open Source COVID19 Medical Supplies
And some ideas regarding image analysis
https://github.com/ieee8023/covid-chestxray-dataset
There are some Hackathons around as well;
https://covid-global-hackathon.devpost.com
https://www.codevscovid19.org/
You can search #BuildforCOVID19
6.Code
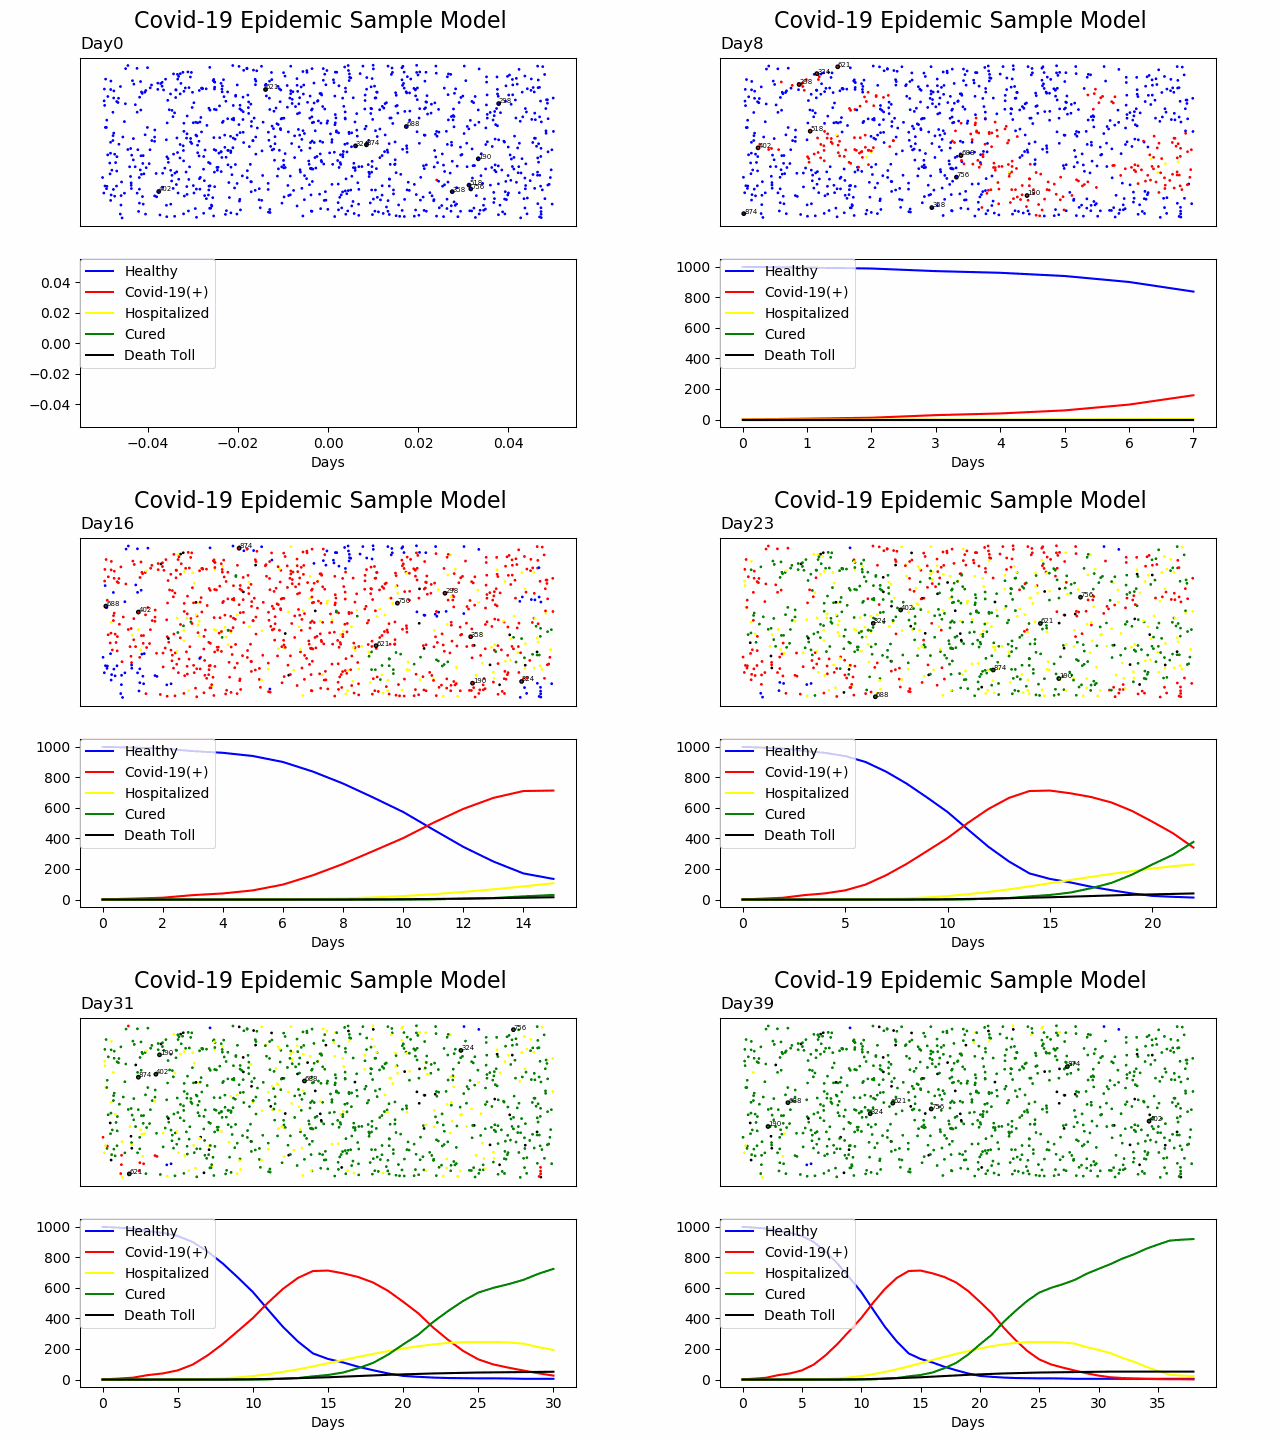
1) You can build your own epidemic model at home.
I just made some small changes
import pandas as pd
import matplotlib.pyplot as plt
import math
import glob
import random
from PIL import Image
def point(xlimit,ylimit):
    x = random.uniform(0,xlimit)
    y = random.uniform(0,ylimit)
    return x,y
def Generate(GrupSize,xlimit,ylimit):
    df = pd.DataFrame(columns='X,Y,Covid-19,Day'.split(','))

    for i in range(GrupSize):
        df.loc[i,'X'], df.loc[i,'Y'] = point(xlimit,ylimit)
        df.loc[i,'Covid-19'] = False

    samplesize = math.floor(GrupSize/100)
    MoversList = df.sample(n = samplesize).index.values.tolist()

    StatofDay = pd.DataFrame(columns='Healthy,Covid-19(+),Hospitalized,Cured,Dead'.split(','))
    return df, StatofDay, MoversList

def plt1color(df):
    cols=[]
    for l in df.index:
        if df.loc[l,'Covid-19']==True: #Infected
            cols.append('red')
        elif df.loc[l,'Covid-19']==666: #Dead
            cols.append('black')
        elif df.loc[l,'Covid-19']==115: #Hospitalized
            cols.append('yellow')
        elif df.loc[l,'Covid-19']==7: #Cured
            cols.append('green')
        else:
            cols.append('blue') #Healthy
    return cols
def plt2color(Stat):
    cols=[]
    for i in Stat.columns:
        if i=='Covid-19(+)': #Infected
            cols.append('red')
        elif i=='Dead': #Dead
            cols.append('black')
        elif i=='Hospitalized': #Hospitalized
            cols.append('yellow')
        elif i=='Cured': #Cured
            cols.append('green')
        else:
            cols.append('blue') #Healthy
    return cols
def Plot():
    global df, fig, Stat, Day, Moverslist
    cols=plt1color(df)
    ld = ['Healthy','Covid-19(+)','Hospitalized','Cured','Death Toll']
    axs[0].cla()
    axs[0].scatter(df['X'],df['Y'],s=1,c=cols)
    for i in MoversList:
        axs[0].scatter(df.loc[i,'X'],df.loc[i,'Y'],s=6,facecolors='none', edgecolors='black')
        axs[0].text(df.loc[i,'X']+0.02, df.loc[i,'Y']+0.02, str(i), fontsize=5)
    cols=plt2color(Stat)
    sDay = str(Day)
    title = 'Day' + sDay
    axs[0].set_title(title,loc='left')
    axs[0].set_yticklabels([])
    axs[0].set_xticklabels([])
    axs[0].tick_params(
#    axis='both',       # changes apply to the x-axis
    which='both',      # both major and minor ticks are affected
    bottom=False,      # ticks along the bottom edge are off
    top=False,         # ticks along the top edge are off
    right=False,      # ticks along the right edge are off
    left=False,         # ticks along the left edge are off
    labelbottom=False) # labels along the bottom edge are off
    axs[1].cla()
    axs[1].plot(Stat.Healthy,label=ld[0],color=cols[0])
    axs[1].plot(Stat['Covid-19(+)'],label=ld[1],color=cols[1])
    axs[1].plot(Stat.Hospitalized,label=ld[2],color=cols[2])
    axs[1].plot(Stat.Cured,label=ld[3],color=cols[3])
    axs[1].plot(Stat.Dead,label=ld[4],color=cols[4])
#    axs[1].set_prop_cycle(color=cols)
    axs[1].legend(bbox_to_anchor=(0, 1), loc='upper left', borderaxespad=0.)
    plt.xlabel('Days')
#    plt.show()
    if Day<10 : sDay = '0' + sDay
    title = 'Day' + sDay + '.png'
    plt.savefig(title)
    return
def Png_to_gif():
    # Create frames
    frames = []
    imgs = sorted(glob.glob("*.png"))
    for i in imgs:
        new_frame = Image.open(i)
        frames.append(new_frame)

    # Save into GIF
    frames[0].save('png_to_gif.gif', format='GIF',
          append_images=frames[1:],
          save_all=True,
          duration=500, loop=0)
def infect(Person):
    global df,Day
    if random.random()>0.25 and Day>3 : return
    if df.loc[Person,'Covid-19']==False:
        df.loc[Person,'Covid-19'], df.loc[Person,'Day'] = True, Day


def Move(xlimit,ylimit):
    """
    Move Movers Randomly
    """
    global df, MoversList
    for i in MoversList:
        if (df.loc[i,'Covid-19']==115) or (df.loc[i,'Covid-19']==666) :
           MoversList.remove(i)
        df.loc[i,'X'], df.loc[i,'Y'] = (df.loc[i,'X']+random.uniform(1,xlimit/3))%xlimit, (df.loc[i,'Y']+random.uniform(1,ylimit/3))%ylimit
def check(i,j):
    global df, YesterdayPatients, Distlimit
    Dist = math.sqrt((df.loc[i,'X']-df.loc[j,'X'])**2+(df.loc[i,'Y']-df.loc[j,'Y'])**2)
    flag = ((YesterdayPatients[i]==True) ^ (YesterdayPatients[j]==True)) and Dist<Distlimit
    return flag

def interact():
    global Day, df
    for i in range(len(df)):
        for j in range(i):
            if check(i,j):
                if (df.loc[i,'Covid-19']==False) :
                    infect(i)
                else:
                    infect(j)
def kill():
    global df
    samplesize = math.floor(len(df[df['Covid-19']==True])*.005+len(df[df['Covid-19']==115])*.005)
    if samplesize>len(df[df['Covid-19']==True]):
        return
    df.loc[df[df['Covid-19']==True].sample(n = samplesize).index.values.tolist(),'Covid-19']=666
    return
def hospitilize():
    global df
    samplesize = math.floor(len(df[df['Covid-19']==True])*0.03)
    if samplesize>len(df[df['Covid-19']==True]):
        return
    df.loc[df[df['Covid-19']==True].sample(n = samplesize).index.values.tolist(),'Covid-19']=115
    return
def cure():
    global df, Day
    df.loc[(df['Day']<Day-10) & (df['Covid-19']==True) ,'Covid-19'] = 7
    df.loc[(df['Day']<Day-21) & (df['Covid-19']==115) ,'Covid-19'] = 7
    return


def Tomorrow(): # To Be checked and Resolved!!!
    global df, Day
    Day +=1
    kill()
    hospitilize()
    cure()
    Move(xlimit,ylimit)
    interact()
def Count(Day):
    global df, Stat
    List = list(df['Covid-19'])
    Stat.loc[Day,'Healthy'] = List.count(False)
    Stat.loc[Day,'Covid-19(+)'] = List.count(True)
    Stat.loc[Day,'Hospitalized'] = List.count(115)
    Stat.loc[Day,'Cured'] = List.count(7)
    Stat.loc[Day,'Dead'] = List.count(666)

    return

def write_log(*args):
    global log_file
    line = ' '.join([str(a) for a in args])
    log_file.write(line+'\n')
    print(line)

# Main ---
log_file = open("Log.txt","w+")
n = 1000
xlimit,ylimit=30,30
Distlimit = 1.5
write_log(31*'-')
write_log("Here's the Input Data:")
write_log(8*'- - ')
write_log('Numper of Sample:',n)
write_log('X & Y limites: ',xlimit,', ',ylimit)
write_log('Distance required for Contamination:', Distlimit)
# Day = 0,  Generating Model...
Day = 0
df, Stat, MoversList = Generate(n,xlimit,ylimit)
infect(random.randrange(n))
fig, axs = plt.subplots(2)
fig.suptitle('Covid-19 Epidemic Sample Model', fontsize=16)
Plot()
Count(Day)
write_log(31*'-')
write_log('Day:',Day)
write_log(8*'- - ')
write_log(Stat.loc[Day])
# Day=1
YesterdayPatients = list(df['Covid-19'])
Tomorrow()
Plot()
Count(Day)
write_log(31*'-')
write_log('Day:',Day)
write_log(8*'- - ')
write_log(Stat.loc[Day])

#Main Loop ---
countsames = 0
while Stat.loc[Day, 'Healthy']>0 and Day<100:
    log_file = open("Log.txt","a+")
    if (list(Stat.loc[Day])==list(Stat.loc[Day-1])):
        countsames +=1
        if countsames>2 : break
    else :
        countsames = 0

    YesterdayPatients = list(df['Covid-19'])
    Tomorrow()
    Plot()
    Count(Day)
    write_log(31*'-')
    write_log('Day:',Day)
    write_log(8*'- - ')
    write_log(Stat.loc[Day])
    log_file.close()
Png_to_gif()
Stat.to_excel('Stat.xlsx')
Stat.plot(title='Statistical Data Vs. Days Passed')
plt.savefig('Stat')
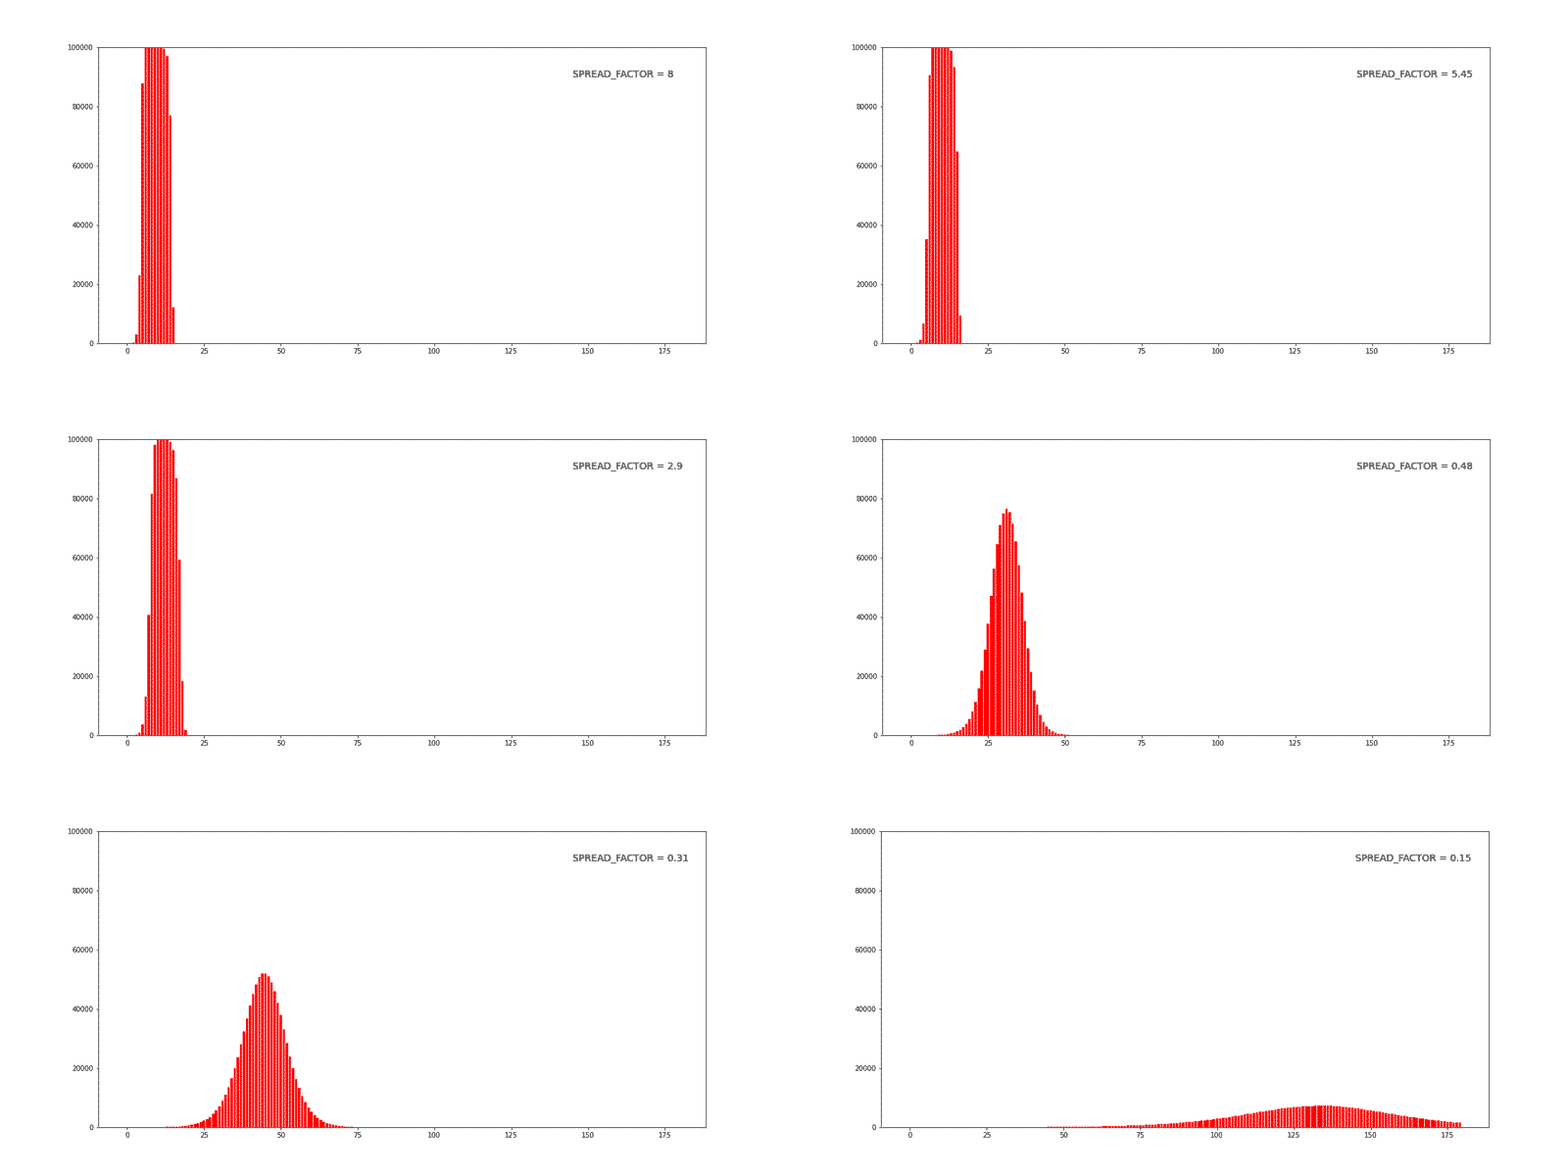
2) You can visualize the impact of social distancing
I just made some small changes
import numpy as np
import pandas as pd
import matplotlib.pyplot as plt
DAYS = 180
POPULATION = 100000
SPREAD_FACTOR = 0.05
DAYS_TO_RECOVER = 10
INITIALLY_AFFECTED = 4
city = pd.DataFrame(data={'id': np.arange(POPULATION), 'infected': False, 'recovery_day': None, 'recovered': False})
city = city.set_index('id')
firstCases = city.sample(INITIALLY_AFFECTED, replace=False)
city.loc[firstCases.index, 'infected'] = True
city.loc[firstCases.index, 'recovery_day'] = DAYS_TO_RECOVER
stat_active_cases = [INITIALLY_AFFECTED]
stat_recovered = [0]
for today in range(1, DAYS):
    city.loc[city['recovery_day'] == today, 'recovered'] = True
    city.loc[city['recovery_day'] == today, 'infected'] = False
    spreadingPeople = city[ (city['infected'] == True)]
    totalCasesToday = round(len(spreadingPeople) * SPREAD_FACTOR)
    casesToday = city.sample(totalCasesToday, replace=True)
    # Ignore already infected or recovered people
    casesToday = casesToday[ (casesToday['infected'] == False) & (casesToday['recovered'] == False) ]
    # Mark the new cases as infected
    city.loc[casesToday.index, 'infected'] = True
    city.loc[casesToday.index, 'recovery_day'] = today + DAYS_TO_RECOVER
    stat_active_cases.append(len(city[city['infected'] == True]))
    stat_recovered.append(len(city[city['recovered'] == True]))
title = "Spread Factor " + str(SPREAD_FACTOR).replace('.', '')
fig = plt.figure(figsize=(16, 8))
plt.bar(np.arange(DAYS), stat_active_cases, color="red")
plt.text(145, 90000, title, fontsize=14)
#plt.show()
plt.savefig(title)
3) You cam use this code in both ideas to generate the animated gif.
import glob
from PIL import Image
def Png_to_gif():
    # Create frames
    frames = []
    imgs = sorted(glob.glob("*.png"))
    for i in imgs:
        new_frame = Image.open(i)
        frames.append(new_frame)

    # Save into GIF
    frames[0].save('result.gif', format='GIF',
          append_images=frames[1:],
          save_all=True,
          duration=500, loop=0)
# Main ---
Png_to_gif()
4) And of course, I did something with Raspberry Pi as well;
A simple Hello World example using GFX-Hat
import requests
import time
import signal
from gfxhat import touch, lcd, backlight, fonts
from PIL import Image, ImageFont, ImageDraw
resp = requests.get('https://thevirustracker.com/free-api?global=stats')
if resp.status_code != 200:
    # This means something went wrong.
    raise ApiError('GET /tasks/ {}'.format(resp.status_code))
dic = resp.json()
total_cases = 'total cases {}'.format(dic['results'][0]['total_cases'])
total_recovered = 'total recovered {}'.format(dic['results'][0]['total_recovered'])
total_deaths = 'total deaths {}'.format(dic['results'][0]['total_deaths'])
new_cases = 'total new cases today {}'.format(dic['results'][0]['total_new_cases_today'])
led_states = [False for _ in range(6)]
width, height = lcd.dimensions()
image = Image.new('P', (width, height))
draw = ImageDraw.Draw(image)
font = ImageFont.truetype(fonts.AmaticSCBold, 12)
text1 = total_cases
text2 = total_recovered
text3 = total_deaths
text4 = new_cases
#text = "Hello World"
w, h = font.getsize(text1)
x = (width - w) // 2
y = (height - h) // 2
draw.text((x, y-25), text1, 1, font)
draw.text((x, y-13), text2, 1, font)
draw.text((x, y), text3, 1, font)
draw.text((x, y+13), text4, 1, font)
def handler(ch, event):
    if event == 'press':
        led_states[ch] = not led_states[ch]
        touch.set_led(ch, led_states[ch])
        if led_states[ch]:
            backlight.set_pixel(ch, 0, 255, 255)
        else:
            backlight.set_pixel(ch, 0, 255, 0)
        backlight.show()
for x in range(6):
    touch.set_led(x, 1)
    time.sleep(0.1)
    touch.set_led(x, 0)
for x in range(6):
    backlight.set_pixel(x, 0, 255, 0)
    touch.on(x, handler)
backlight.show()
for x in range(128):
    for y in range(64):
        pixel = image.getpixel((x, y))
        lcd.set_pixel(x, y, pixel)
lcd.show()
try:
    signal.pause()
except KeyboardInterrupt:
    for x in range(6):
        backlight.set_pixel(x, 0, 0, 0)
        touch.set_led(x, 0)
    backlight.show()
    lcd.clear()
    lcd.show()
7.Links
These are the main points to get help;
https://www.who.int/emergencies/diseases/novel-coronavirus-2019/situation-reports
Github
https://github.blog/2020-03-23-open-collaboration-on-covid-19/
While You are at Home
https://makeymakey.com/blogs/blog/creativity-matters-free-resources-from-authors-while-you-are-at-home
https://www.visualcapitalist.com/global-pandemic-preparedness-ranked/
This one I found an amazing idea:
https://howmuchtoiletpaper.com/
I suggest have a look at “towardsdatascience” and twitter because there are several new kinds of stuff every day about COVID-19.