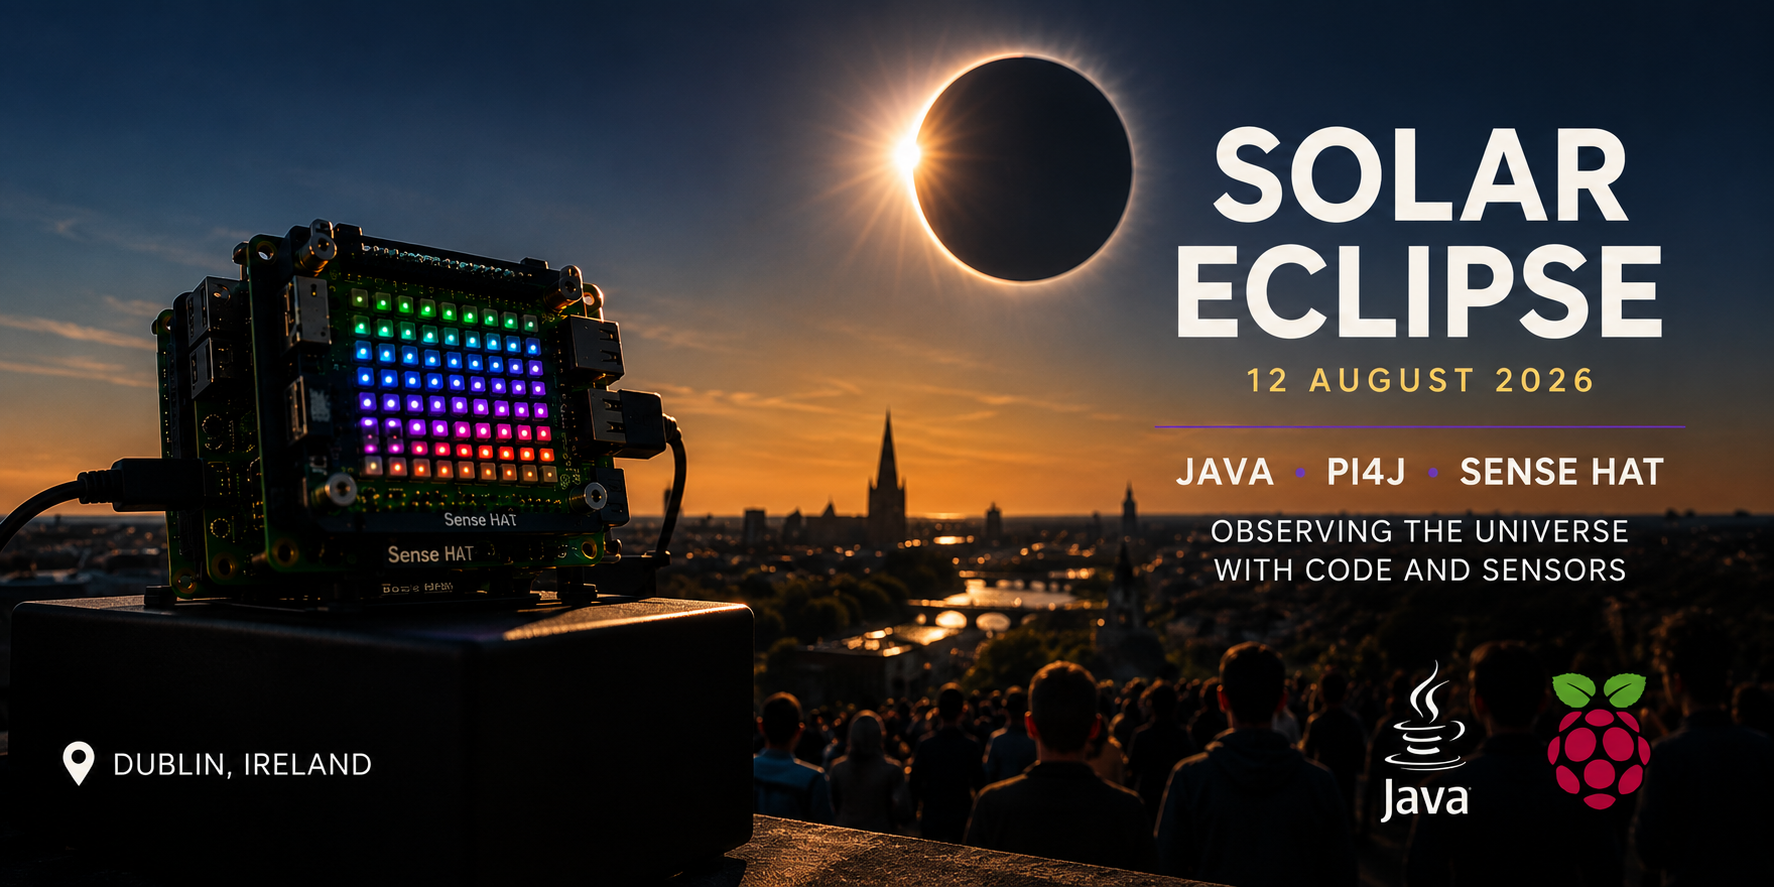
Logging a solar eclipse with the Sense HAT
Log light, temperature, humidity and pressure once per second during a solar eclipse, show a live light meter on the LED matrix, and tag C1–C4 contacts with the joystick.
Eclipse turns the Sense HAT into a small eclipse-logging station. It writes a CSV row every second with the light level from the TCS3400 colour sensor plus temperature, humidity and pressure, draws a live "light meter" bar on the 8×8 LED matrix, and lets you tag the four contacts of the eclipse (C1–C4) with the joystick so you can align them with the light curve later.
Source code: projects/eclipse/Eclipse.java
Just want to record sensor data on a schedule without the eclipse-specific bits? See the generic Logger — same CSV idea, but with
--label,--interval,--durationand--outputflags.
How it works
The Sense HAT v2 ships with a TCS3400 RGB + clear-channel colour sensor. Pi4J exposes it via hat.getColour(), which returns a double[] of [clear, red, green, blue]. The clear channel behaves as a broadband light proxy — perfect for tracking how much sunlight reaches the sensor as the Moon passes in front of the Sun.
The demo aborts with a clear message if it detects a Sense HAT v1, which has no colour sensor.
The main loop runs once per second and:
-
Reads
hat.getColour()forclear, red, green, blue. -
Reads both on-board thermometers —
hat.getTemperatureFromHumidity()(HTS221) andhat.getTemperatureFromPressure()(LPS25H) — so you can compare them and see the temperature drop during totality. -
Reads
hat.getHumidity()andhat.getPressure(). -
Prints a CSV row to
stdout:timestamp,clear,red,green,blue,temp_hts,temp_lps,humidity,pressure,marker -
Draws a vertical bar on the 8×8 matrix whose height tracks the light level and whose colour fades from yellow (daylight) to red (darkness) in real time.
Joystick markers
A joystick listener runs in parallel with the sampling loop. Pressing a direction emits an extra CSV row tagged in the marker column so you can find the exact moment in the light curve later:
UP→ C1 — first contact (Moon touches the Sun's edge)RIGHT→ C2 — totality beginsLEFT→ C3 — totality endsDOWN→ C4 — last contactCENTER→ MARK — free-form observation
Every tag is also echoed to stderr so you can see the click was registered without polluting the CSV on stdout.
Under the hood, the sampling loop and the joystick listener share an AtomicReference<Sample> with the latest reading and write to stdout under a lock, so a tag comes out instantly with the freshest values — even between two scheduled samples.
Running it
This script depends on a specific branch of pi4j-drivers (my igfasouza branch), so clone and install it locally first:
git clone -b igfasouza https://github.com/igfasouza/pi4j-drivers.git
cd pi4j-drivers
mvn install
Then run it with JBang on a Raspberry Pi with a Sense HAT v2 attached, redirecting stdout to a file:
jbang projects/eclipse/Eclipse.java > eclipse.csv
Tips for the day
- Start the logger 15–20 minutes before first contact to get a clean baseline.
- Leave the Pi outdoors, facing straight up, with no hand or cloud shadow — the TCS3400 sits on the top face of the HAT.
- The raw
clearvalues depend on the driver's gain and integration time. For an eclipse it's the relative variation that matters, not the absolute number. - Both thermometers usually read a bit high because the LED matrix and the Pi itself warm the board. During totality you should still see a clear dip on both — comparing them is half the fun.